UC Economics Center
Infographics
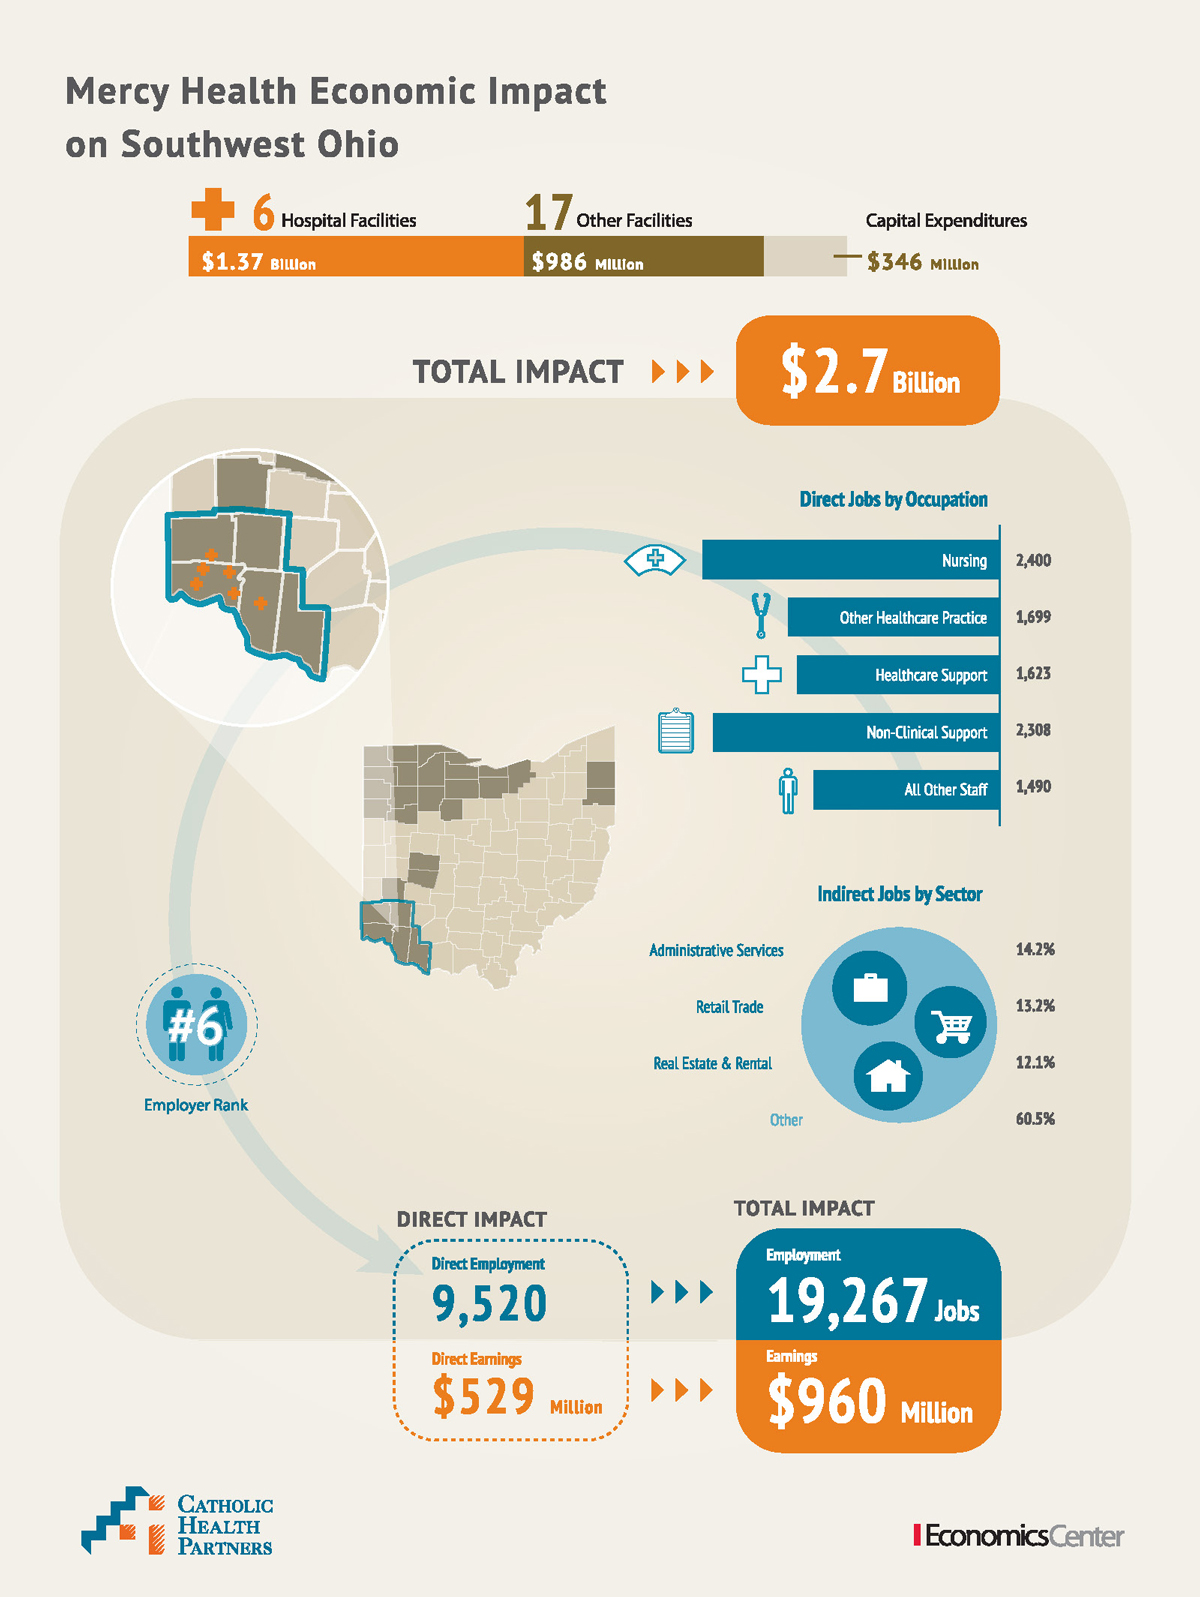
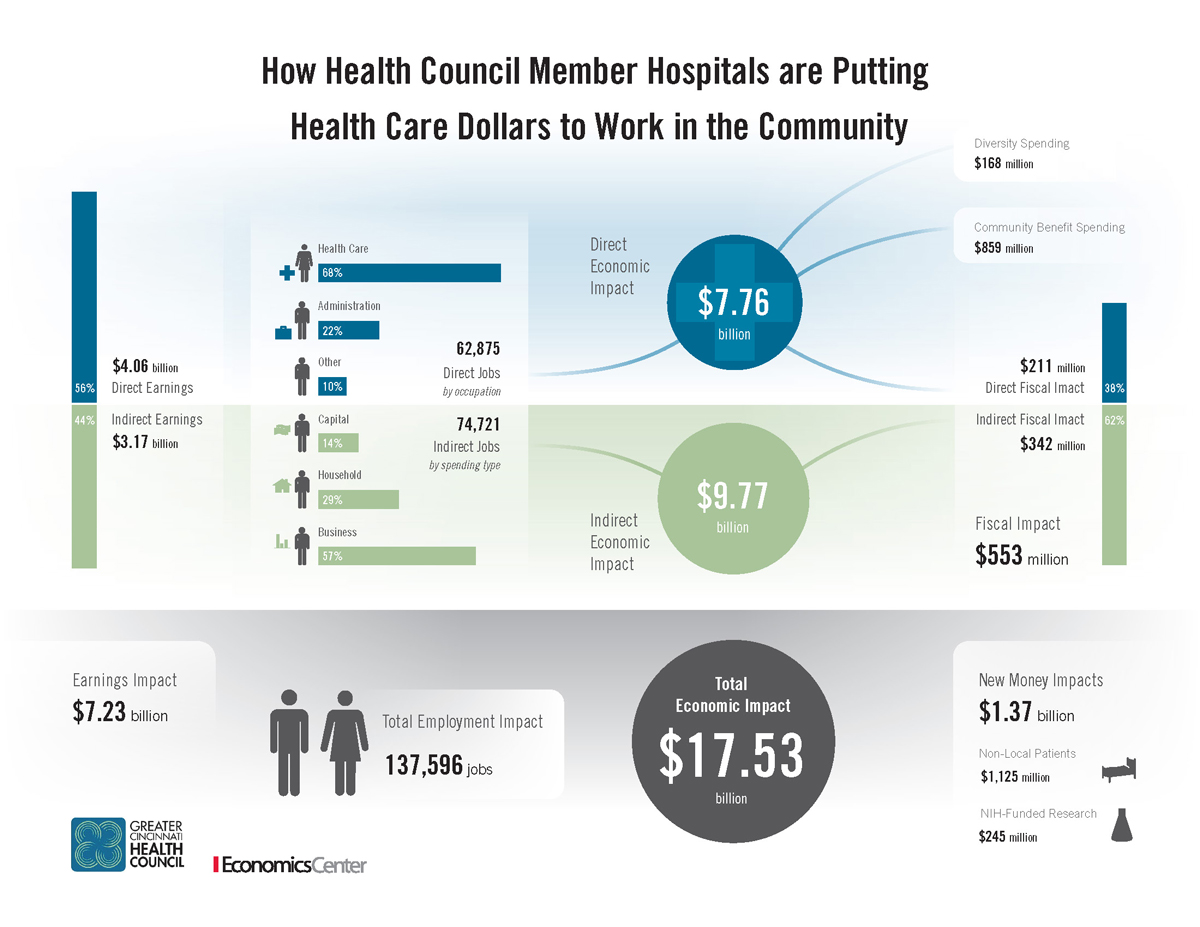
These infographics were created to illustrate regional economic impacts of hospitals in Ohio and Kentucky in support of regionally-based research. Each of these were part of larger reports and included similar graphics for several regions.
Starting with provided data sets, I worked directly with the client to create graphics that were accurate, easy-to-read, and effective at getting across main talking points during fast-moving presentations.